前言
最早笔者用 Python 画中国地图时,会准备 bou2_4p.shp 文件,然后封装一个读取 shapefile 并添加到 GeoAxes 上的函数,别的项目要用时就把数据和函数复制粘贴过去。Cartopy 系列:从入门到放弃 里就是这么做的。
后来工作中用到了 Clarmy 开发的 cnmaps 包,只用两行就能快速绘制地图,非常方便。同时萌生了自己实现一个功能类似的包的想法,遂开发出了 frykit。
主要功能就是三块:
- 画中国省市
- 裁剪(白化)和掩膜
- 画指北针、比例尺等小装饰
最近觉得功能足够完善和稳定了,于是在博客里正式介绍一下。虽说如此,GitHub 页面 的用法说明已经足够详细了,所以本文就列点特色功能。
架构
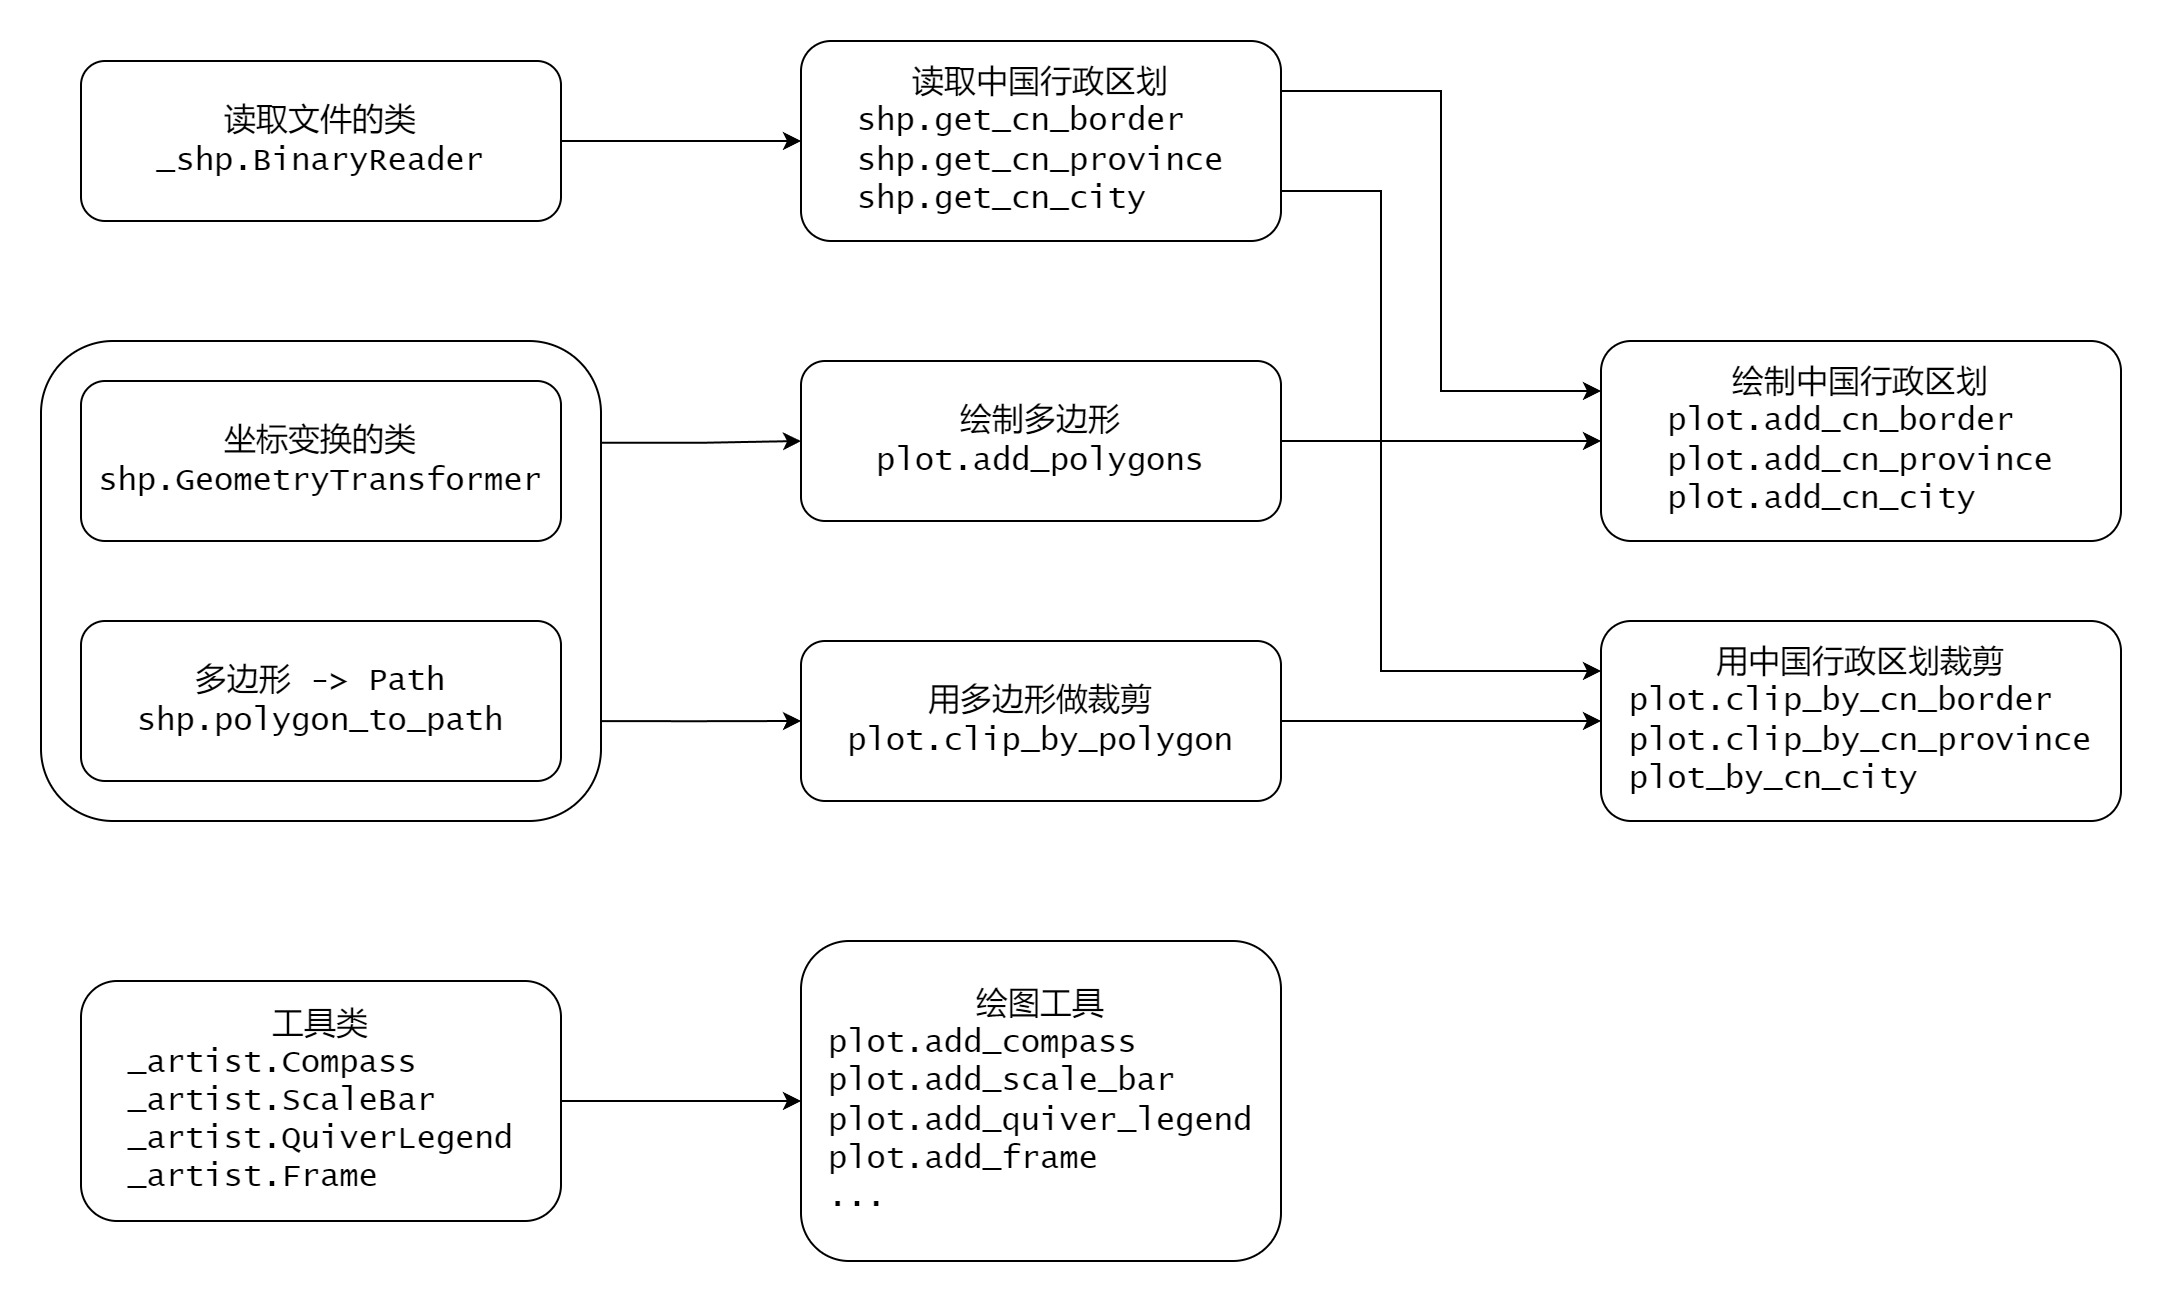
风格
Frykit 的画图函数都是 frykit.plot.add_xxx(ax, **kwargs) 这种风格的,第一个参数总是 ax。
裁剪类的函数则是 frykit.plot.clip_by_xxx(artist, **kwargs) 这种风格的,第一个参数是被裁剪的对象,ax 倒不需要传入。
因为笔者水平有限,所以都是以函数而非类方法的形式调用的。
在普通 Axes 上画
import matplotlib.pyplot as plt
import frykit.plot as fplt

colors = plt.cm.Set3.colors
fig, ax = plt.subplots()
ax.set_aspect(1)  # 记得调比例
fplt.set_map_ticks(ax, [70, 140, 0, 60])  # 设置范围和刻度
fplt.add_cn_province(ax, fc=colors)  # 添加省界
fplt.label_cn_province(ax)  # 添加省名
fplt.add_nine_line(ax)  # 添加九段线

plt.show()
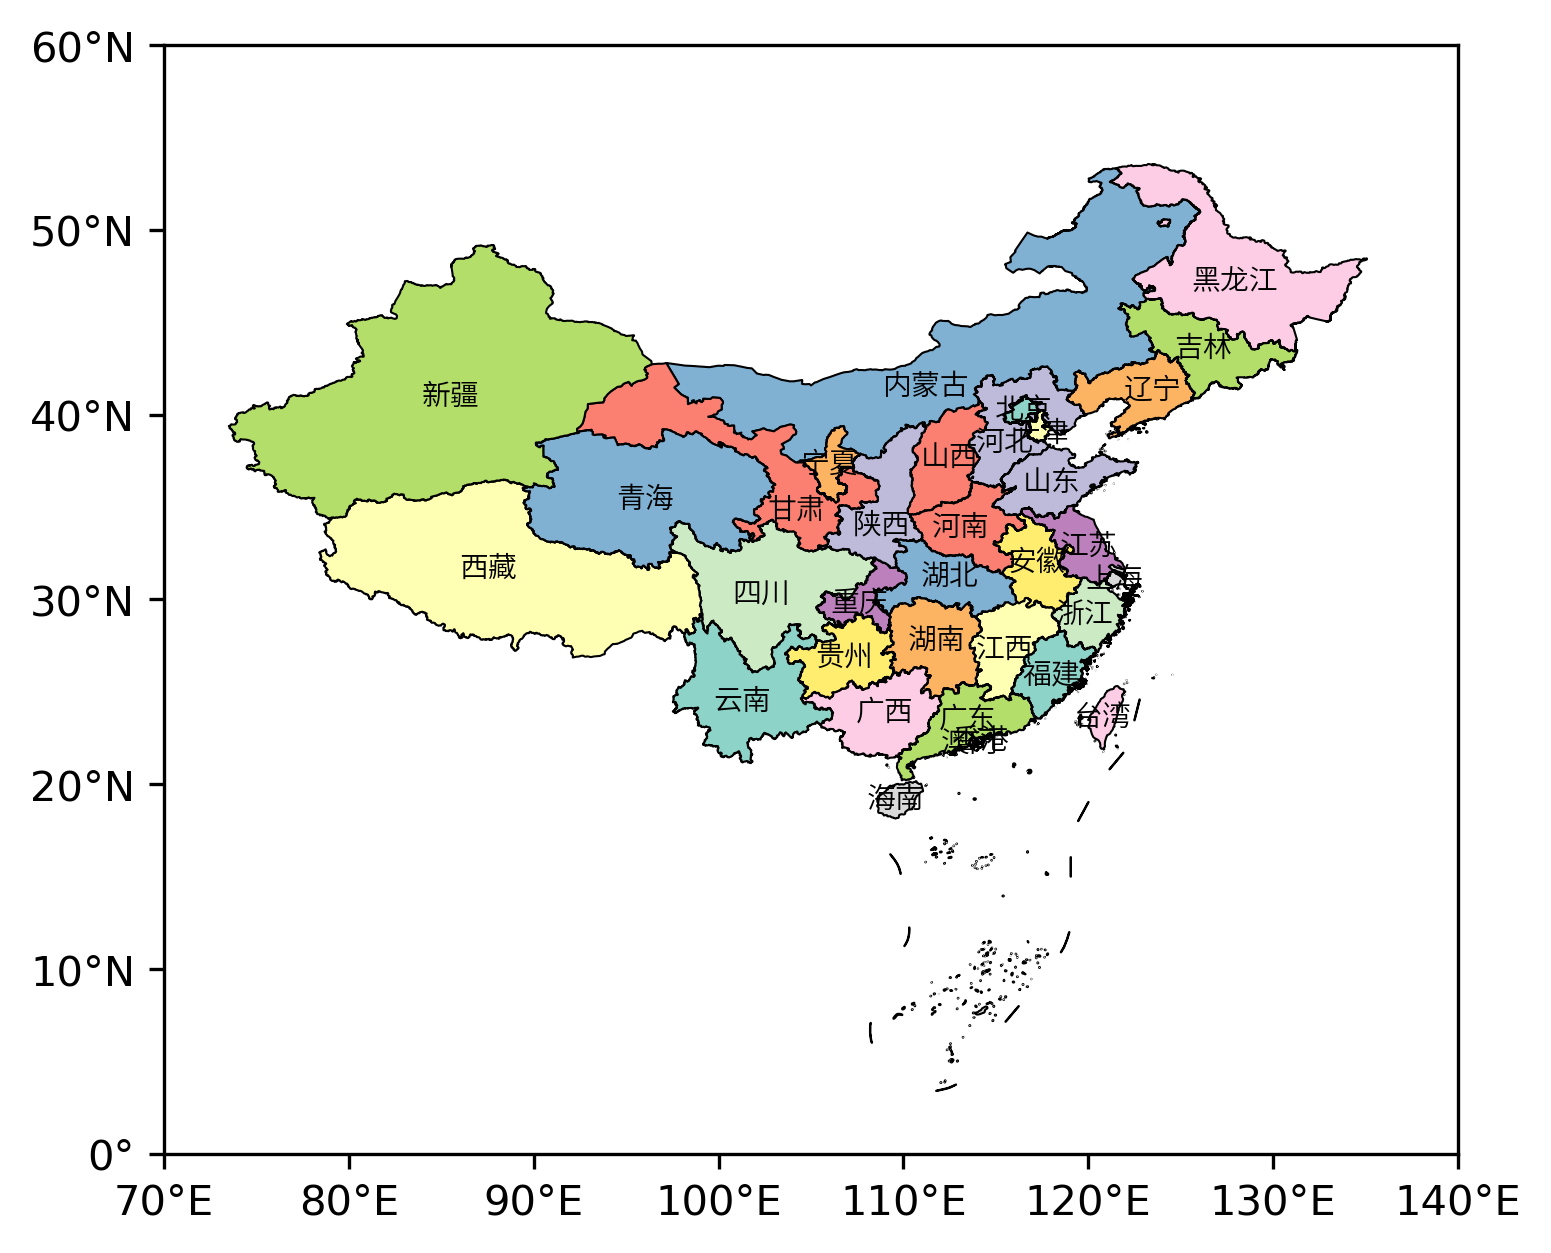
懒得导入 Cartopy 了,就想用 Matplotlib 原生的 Axes 画一张等距圆柱投影的地图,那么 frykit 的画图函数都支持,经纬度标签也给安排上。
加快画图速度
用 Cartopy 的 add_geometries,在等距方位投影里画全国市界,在笔者的笔记本上首次耗时 32 秒,反复绘制耗时 0.5 秒:
import matplotlib.pyplot as plt
import cartopy.crs as ccrs
import frykit.shp as fshp
import frykit.plot as fplt

colors = plt.cm.Set3.colors
crs = ccrs.PlateCarree()
ax = plt.axes(projection=fplt.CN_AZIMUTHAL_EQUIDISTANT)  # 等距方位投影
ax.set_extent([74, 136, 13, 57], crs)
ax.add_geometries(fshp.get_cn_city(), crs, fc=colors, ec='k', lw=0.5)

plt.show()
把 add_geometries 一行改为
fplt.add_cn_city(ax, fc=colors) # 添加市界
首次耗时 1.5 秒,反复绘制耗时 0.5 秒。
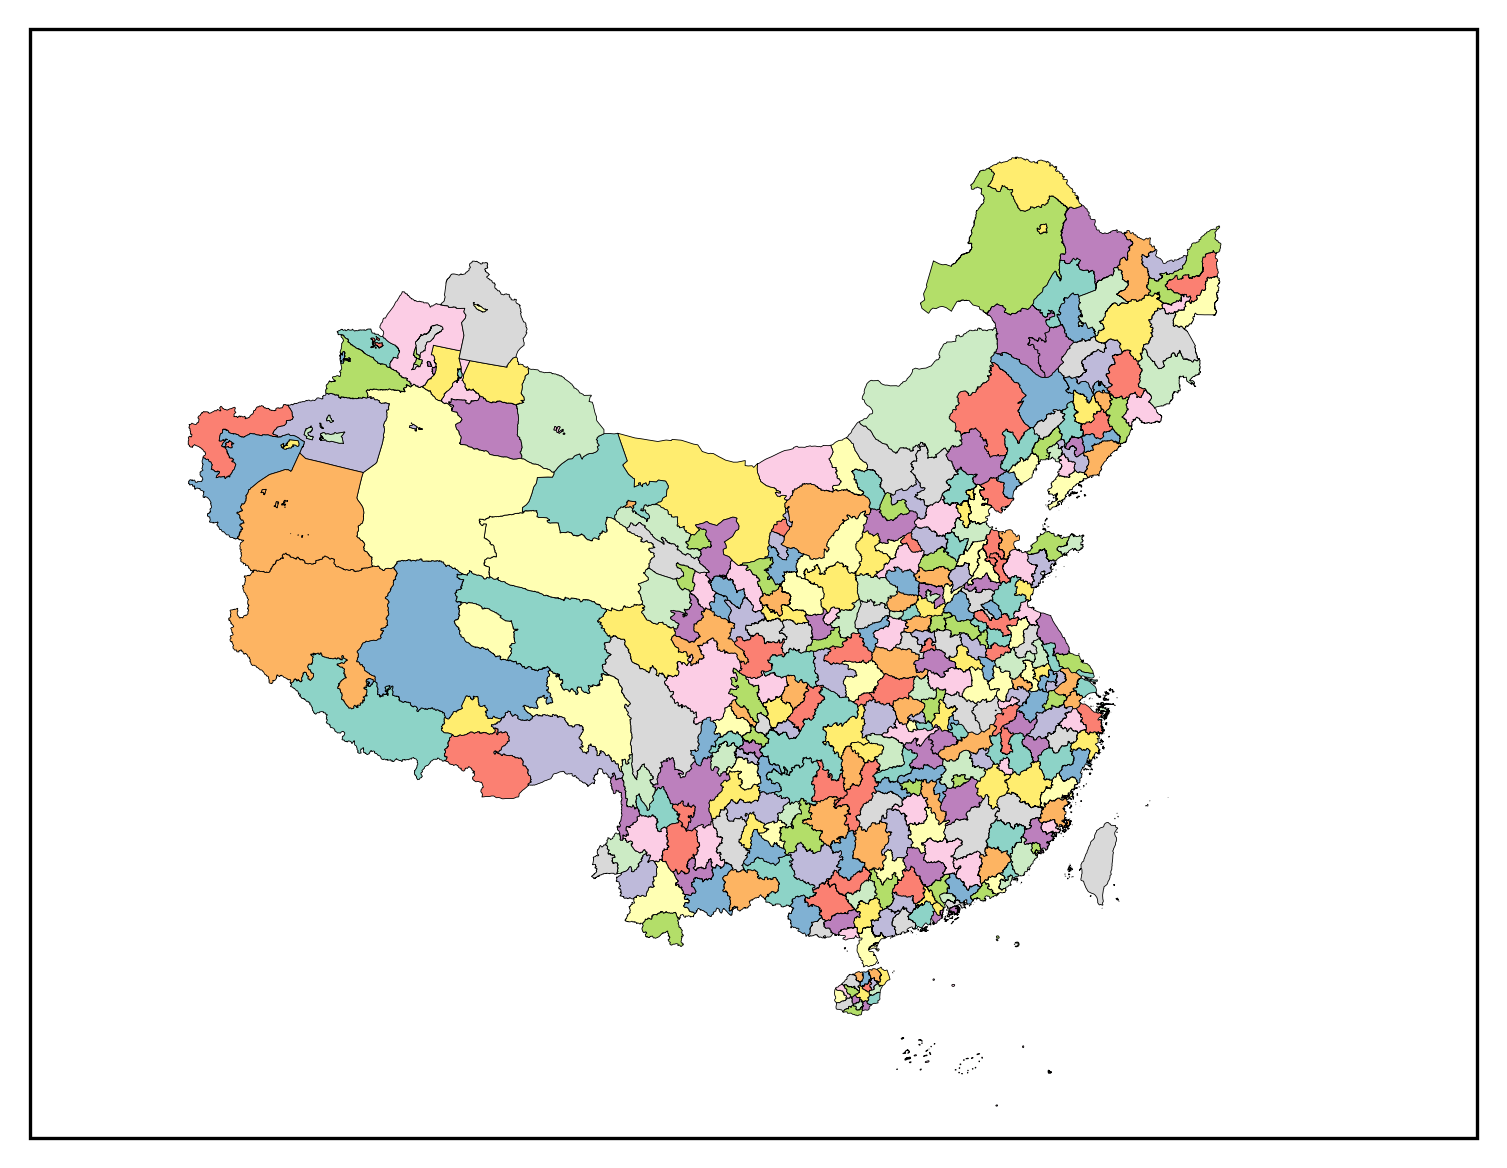
就是因为笔者被 add_geometries 急死了,所以 frykit 默认直接用 pyproj 做不同投影间的坐标变换,速度更快但也很容易在地图边界产生乱七八糟的效果。
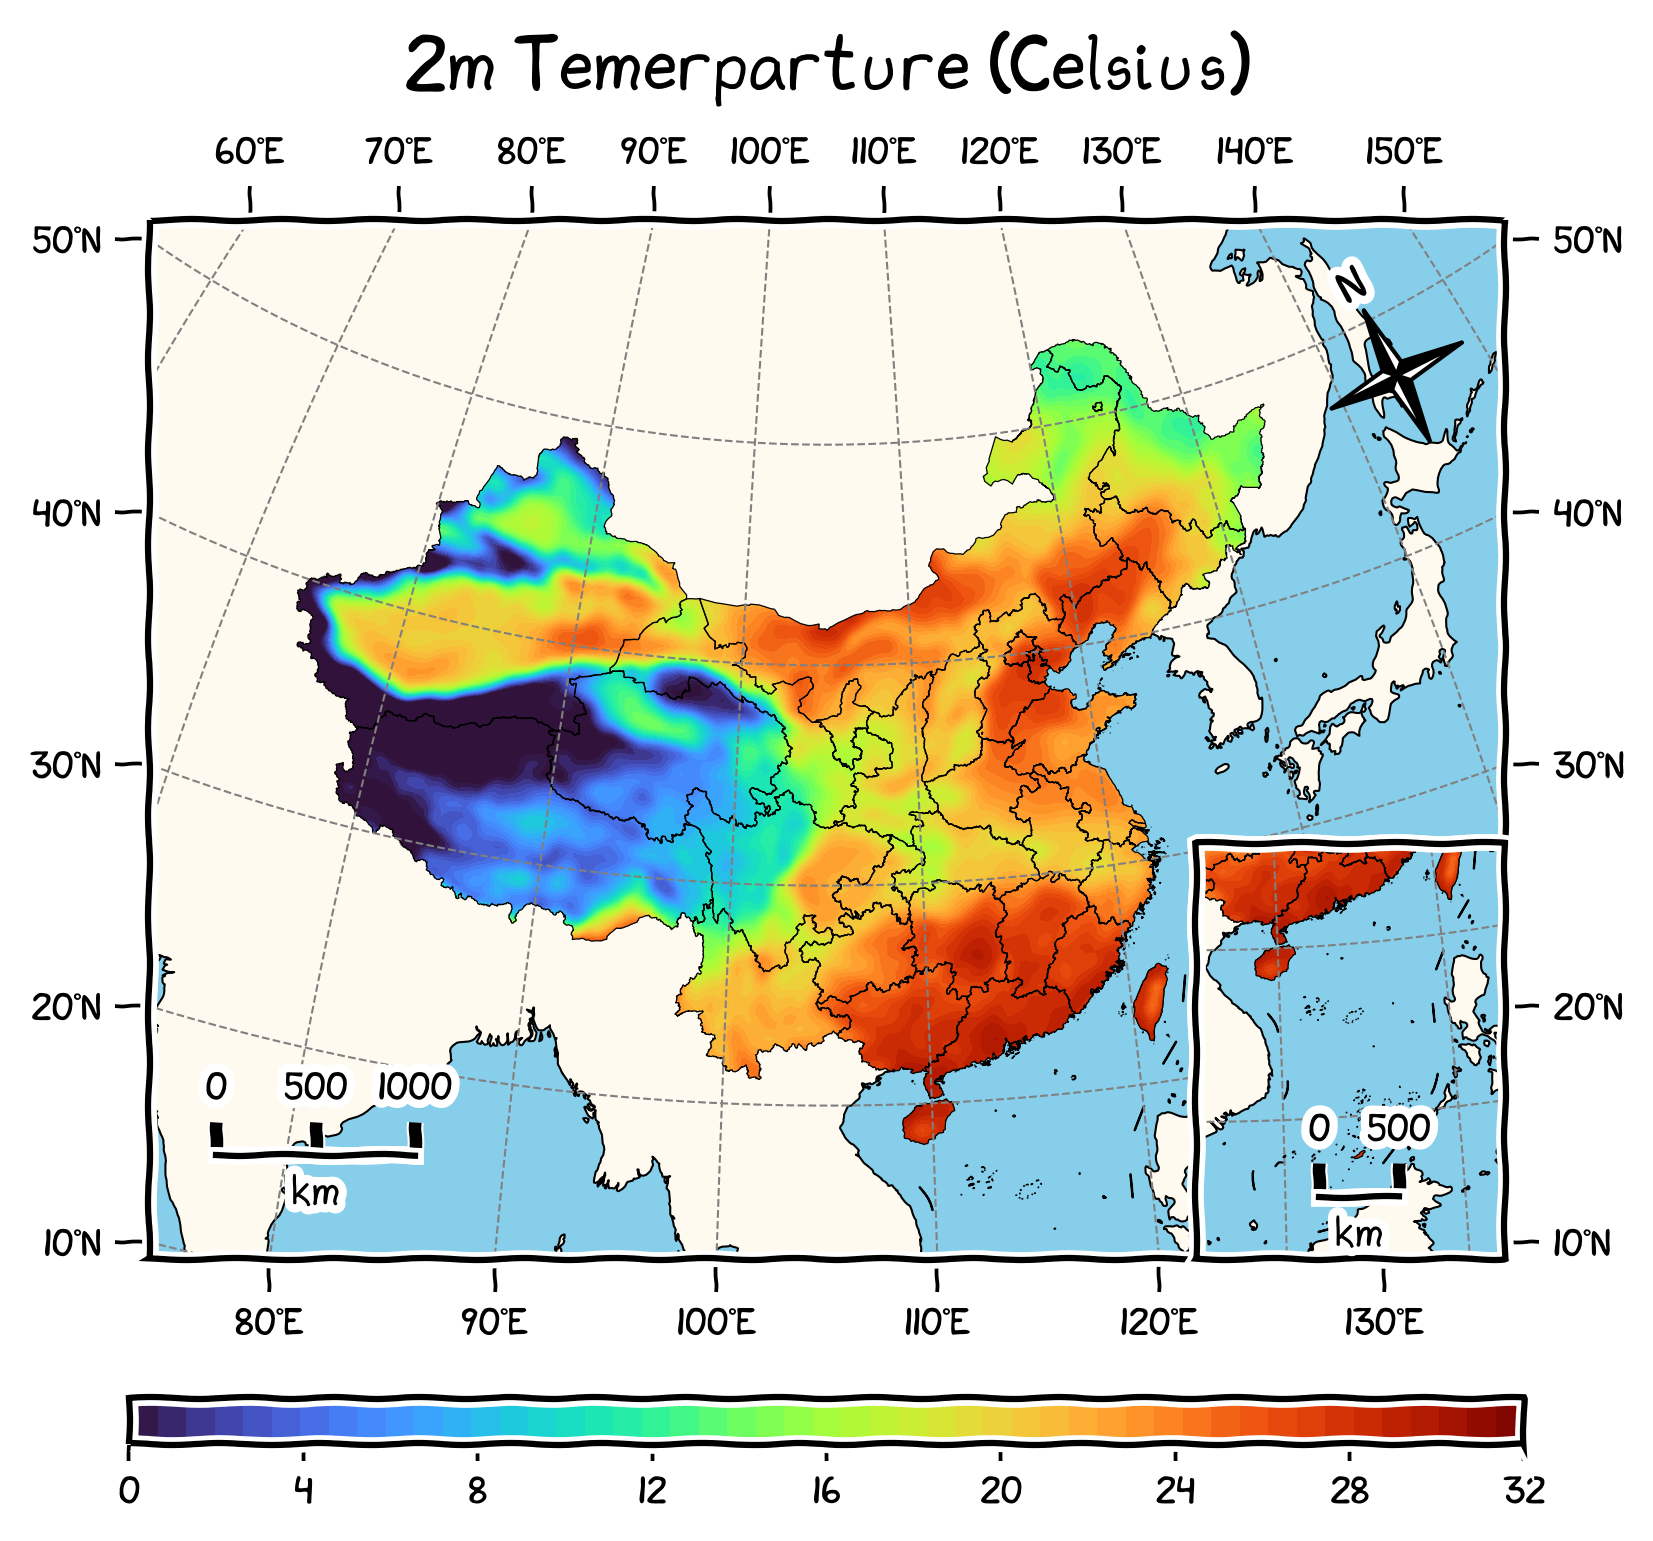
防白化出界
用国界裁剪填色图,但 GeoAxes 的显示范围只有东南一隅,就会出界一大片:
import matplotlib.pyplot as plt
import cartopy.crs as ccrs
import frykit.plot as fplt
import frykit.shp as fshp

# 读取测试用数据
data = fplt.load_test_data()
lon = data['longitude']
lat = data['latitude']
t2m = data['t2m']

crs = ccrs.PlateCarree()
ax = plt.axes(projection=fplt.CN_AZIMUTHAL_EQUIDISTANT)
fplt.set_map_ticks(ax, [105, 125, 15, 35], dx=5, dy=5)
fplt.add_cn_border(ax)  # 添加国界

cf = ax.contourf(lon, lat, t2m, 20, cmap='rainbow', transform=crs)

# 非等距圆柱投影裁剪的方式
from matplotlib.path import Path
from cartopy.mpl.patch import geos_to_path
polygon = fshp.get_cn_border()
path = Path.make_compound_path(*geos_to_path(polygon))
cf.set_clip_path(path, crs._as_mpl_transform(ax))

plt.show()
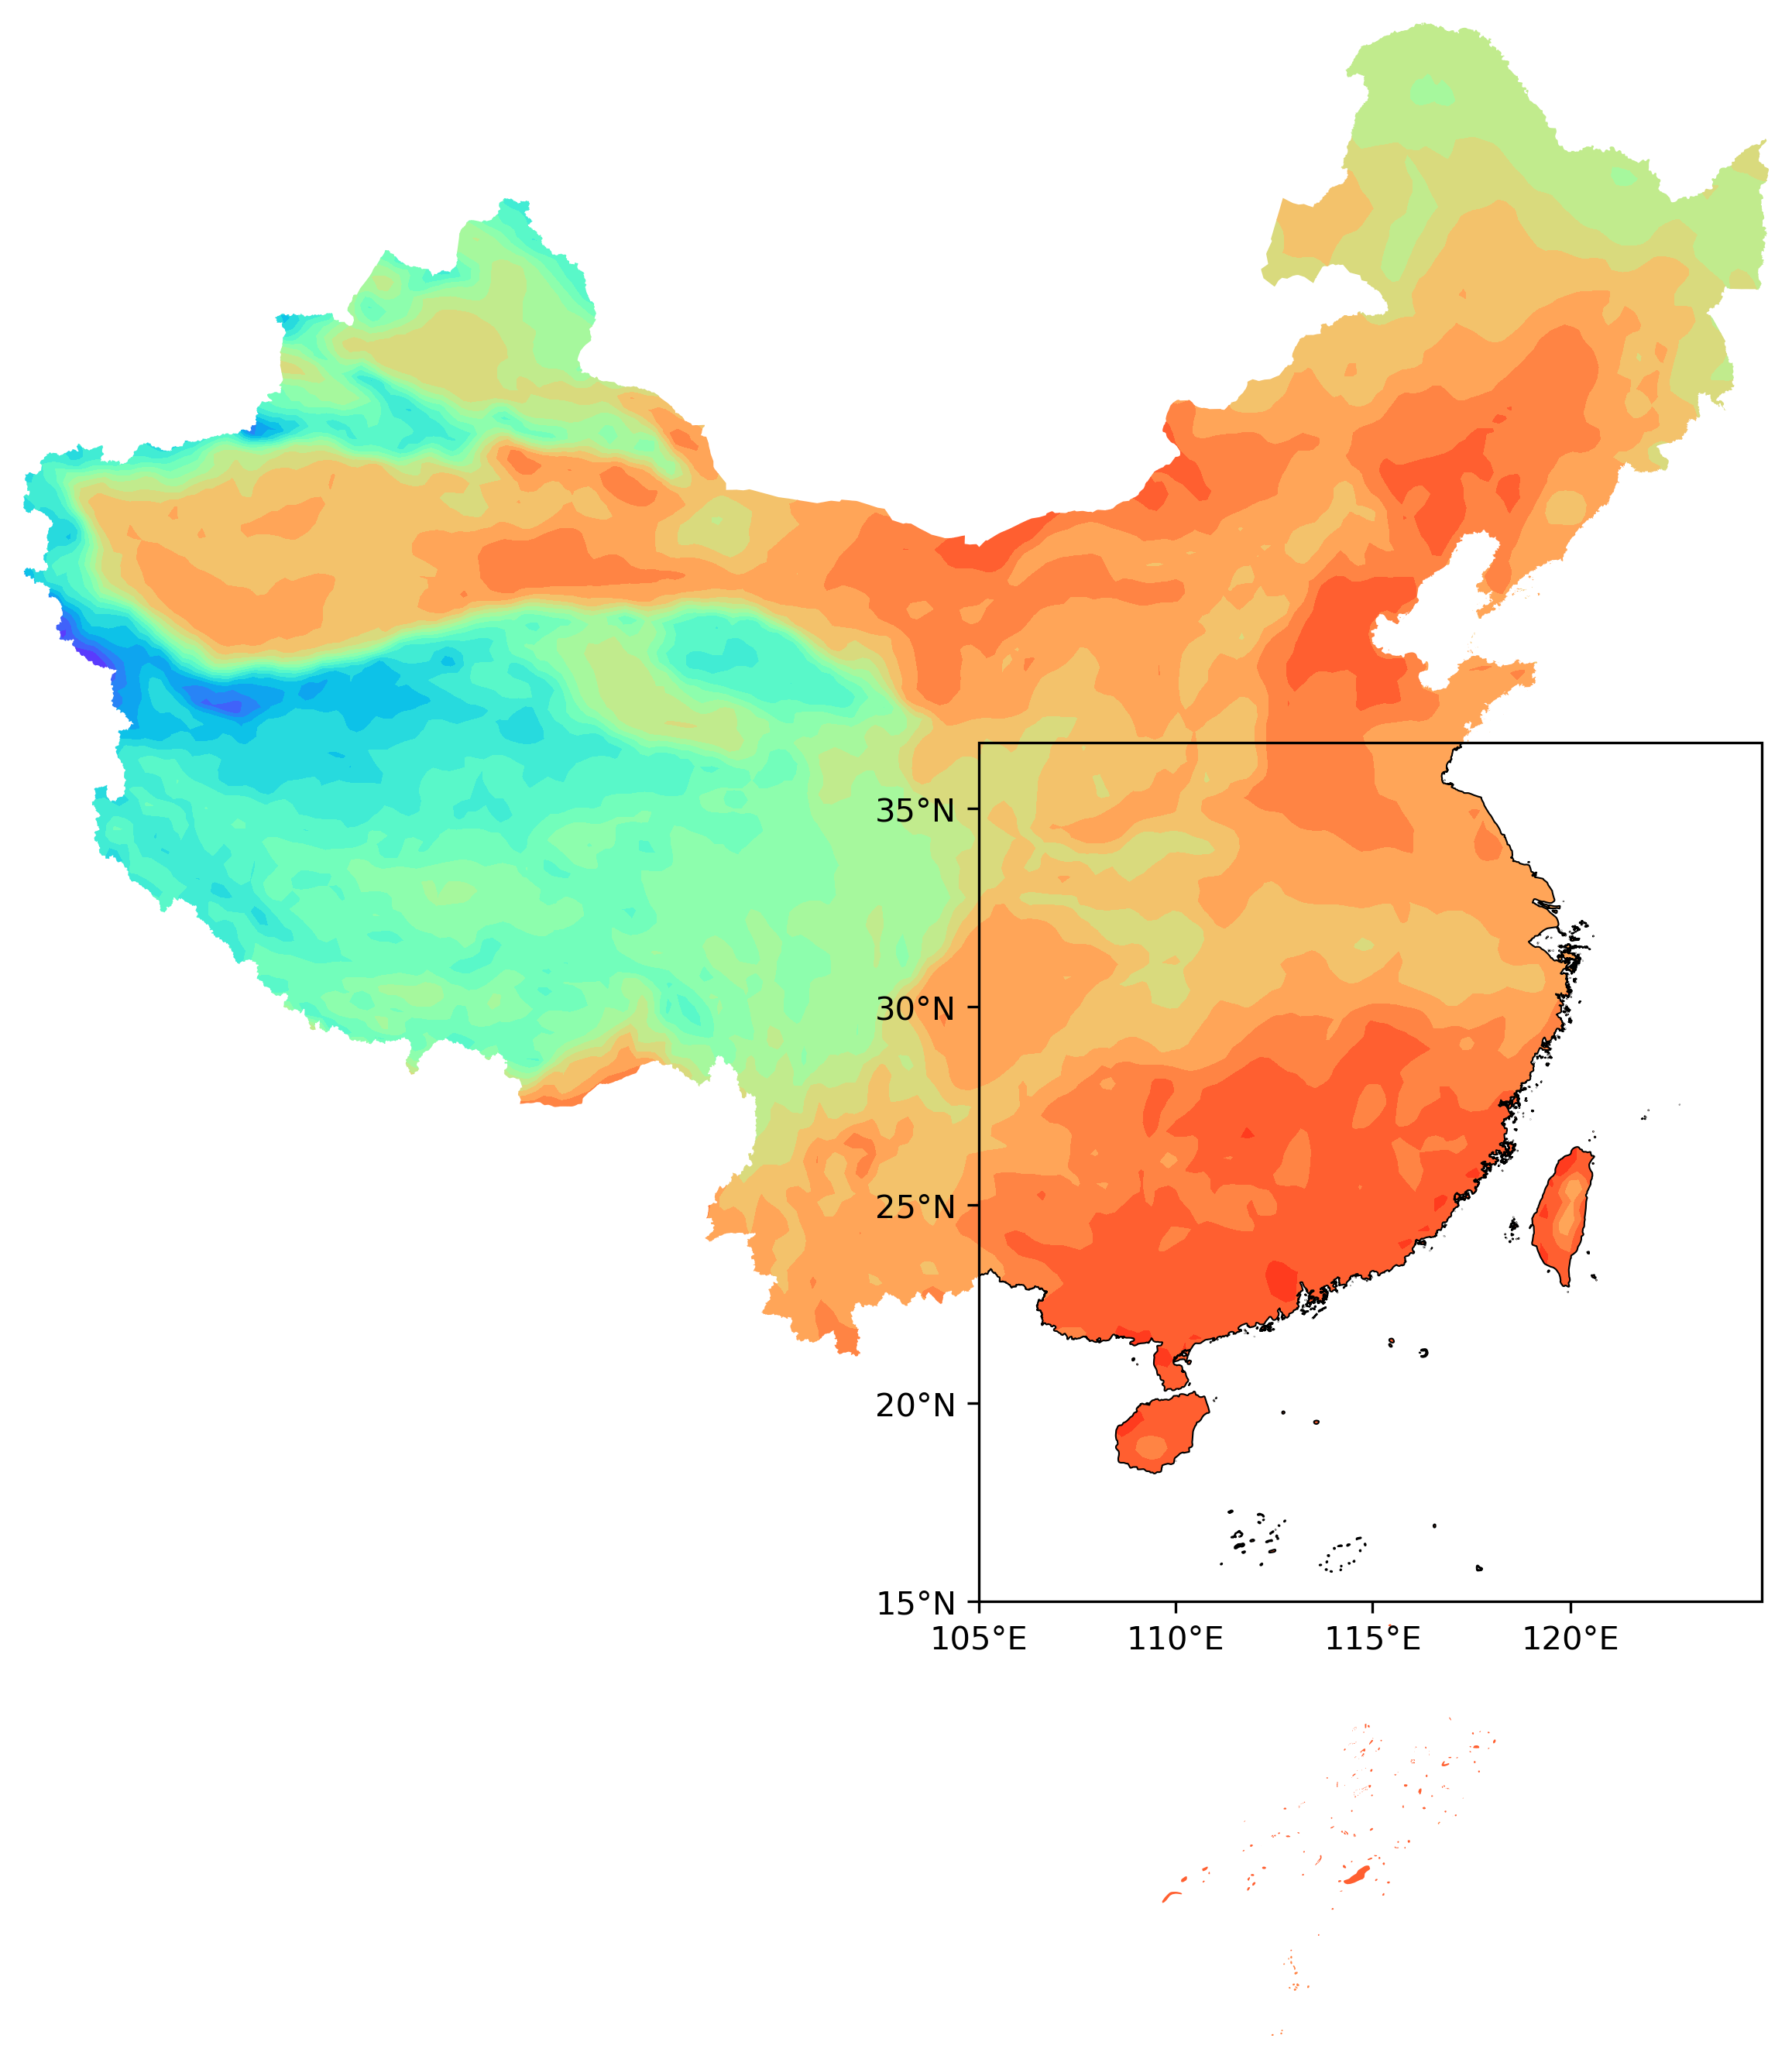
Frykit 一行就能实现其它投影的裁剪,并且自带防出界:
fplt.clip_by_cn_border(cf) # 用国界裁剪
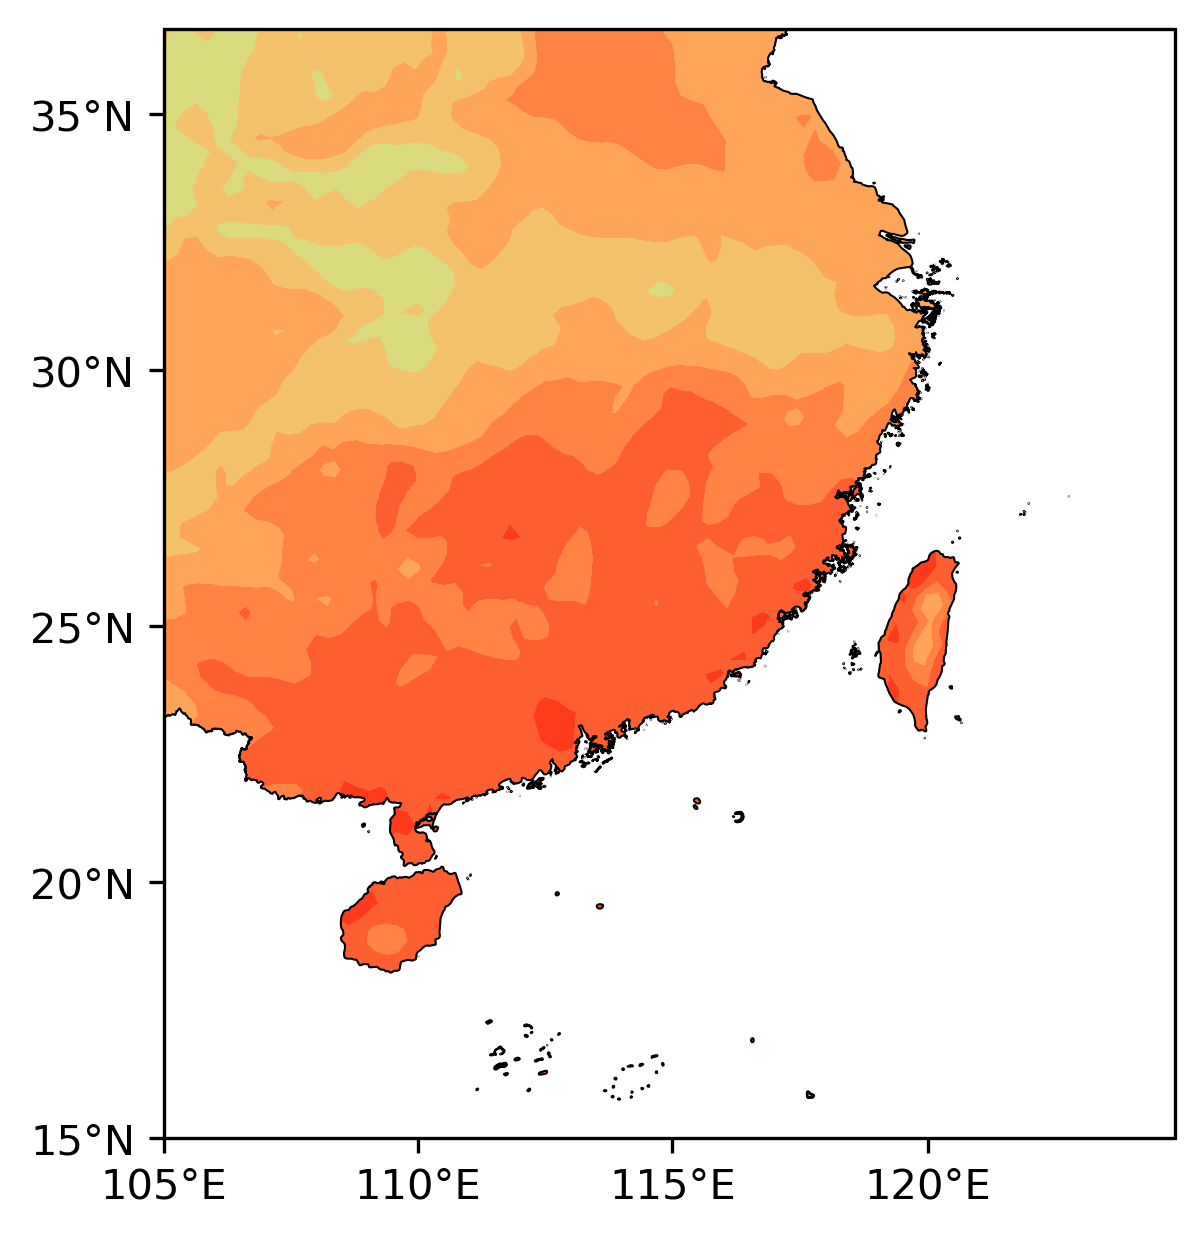
耗时是 6.4 秒 vs. 2.5 秒。原理详见 Cartopy 系列:裁剪填色图出界问题。
比例尺
import matplotlib.pyplot as plt
import cartopy.crs as ccrs
import frykit.plot as fplt

crs = ccrs.PlateCarree()
ax = plt.axes(projection=fplt.WEB_MERCATOR)
fplt.set_map_ticks(ax, [70, 140, 0, 60])
ax.coastlines()
fplt.add_scale_bar(ax, 0.5, 0.4)  # 添加比例尺

plt.show()
比例尺的长度是根据投影现算的,交互模式中长度会跟着变。
指北针
import matplotlib.pyplot as plt
import cartopy.crs as ccrs
import frykit.plot as fplt

crs = ccrs.PlateCarree()
ax = plt.axes(projection=fplt.CN_AZIMUTHAL_EQUIDISTANT)
fplt.set_map_ticks(ax, [74, 136, 13, 57])
ax.coastlines()
fplt.add_compass(ax, 0.5, 0.5)  # 添加指北针

plt.show()
指北针的方向也是根据投影现算的,交互模式中方向会跟着变。
quiver 图例
import numpy as np
import matplotlib.pyplot as plt
import frykit.plot as fplt

X = np.arange(-10, 10, 1)
Y = np.arange(-10, 10, 1)
U, V = np.meshgrid(X, Y)

fig, ax = plt.subplots()
Q = ax.quiver(X, Y, U, V)
fplt.add_quiver_legend(Q, U=10)  # 添加图例

plt.show()
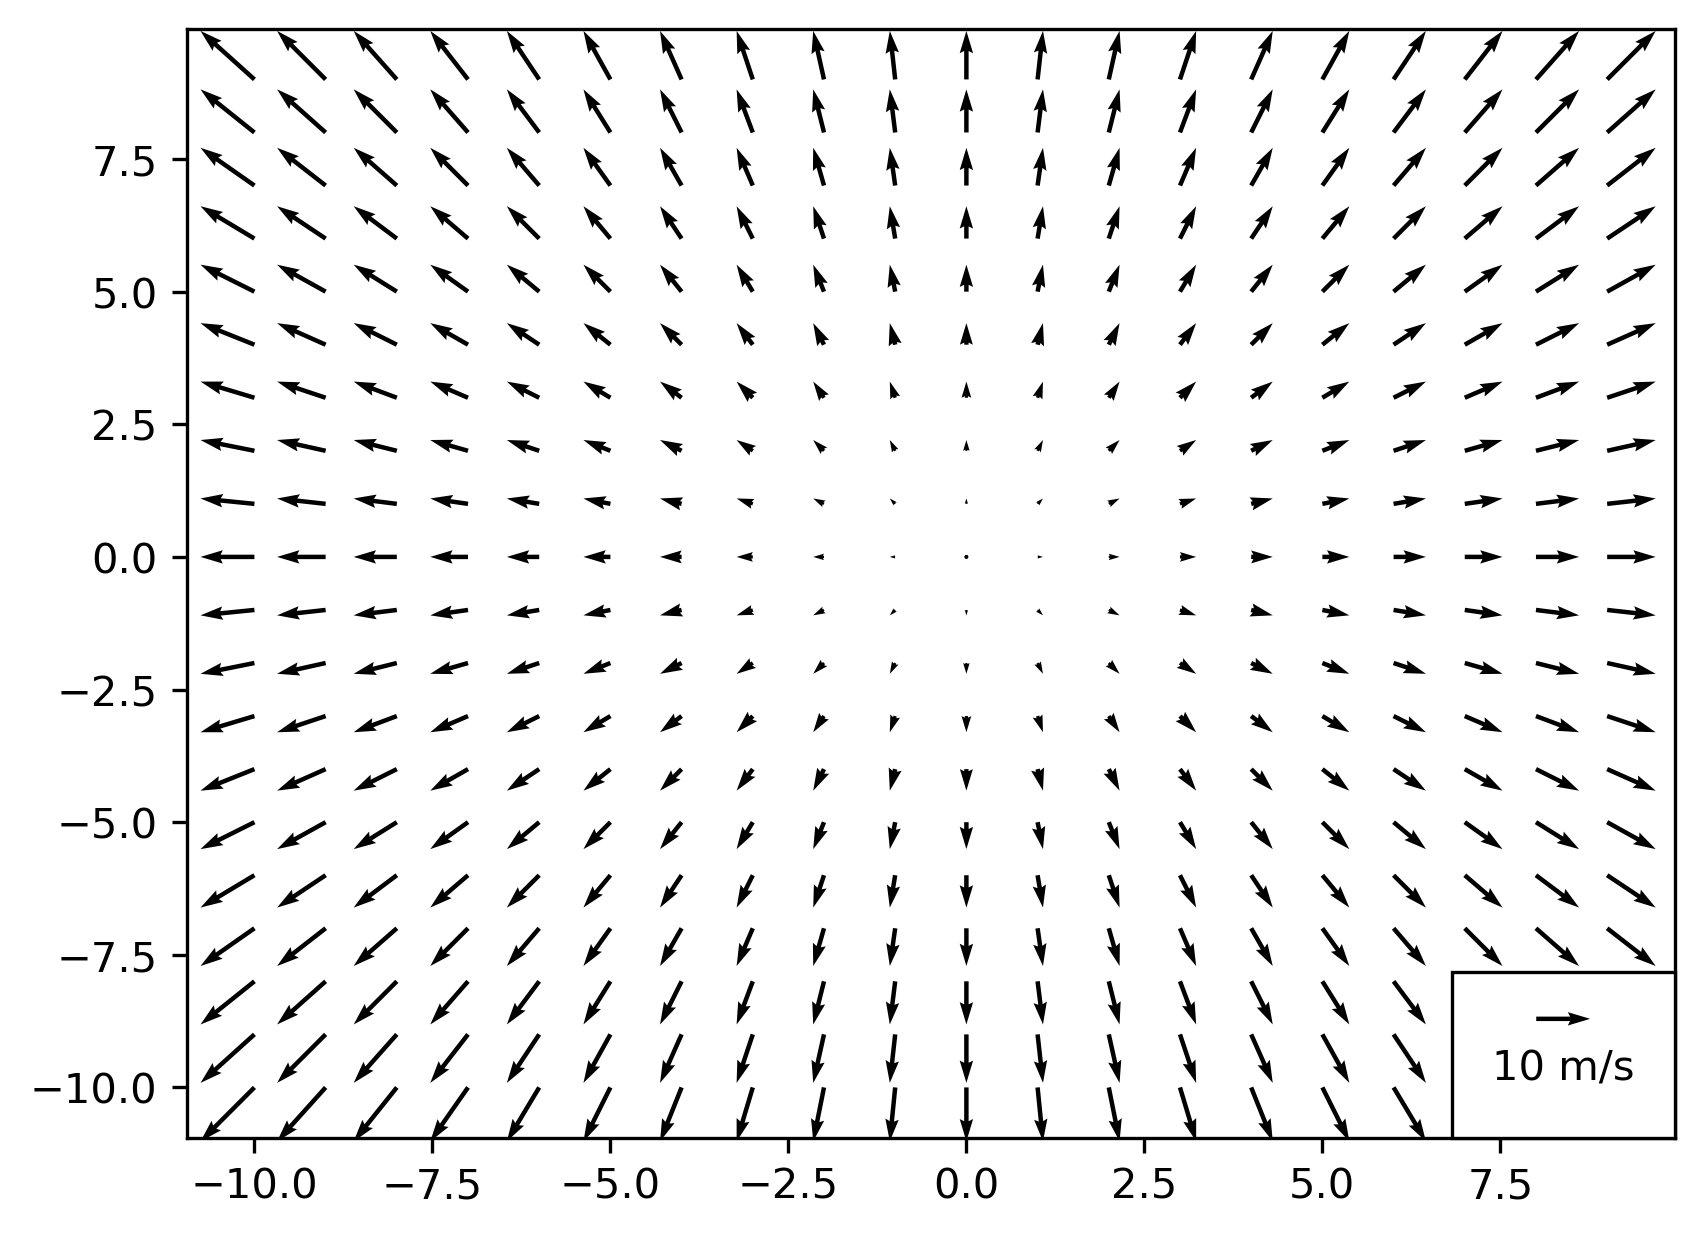
Matplotlib 的 quiverkey 摆放位置过于自由,且需要手动输入 label。Frykit 将图例自动定位到角落,附带方形的背景,给矢量长度加上单位。
GMT 边框
import matplotlib.pyplot as plt
import cartopy.crs as ccrs
import frykit.plot as fplt

crs = ccrs.PlateCarree()
ax = plt.axes(projection=crs)
fplt.set_map_ticks(ax, [70, 140, 0, 60])
ax.stock_img()
fplt.add_cn_province(ax)
fplt.add_nine_line(ax)
fplt.add_frame(ax)  # 添加边框

plt.show()
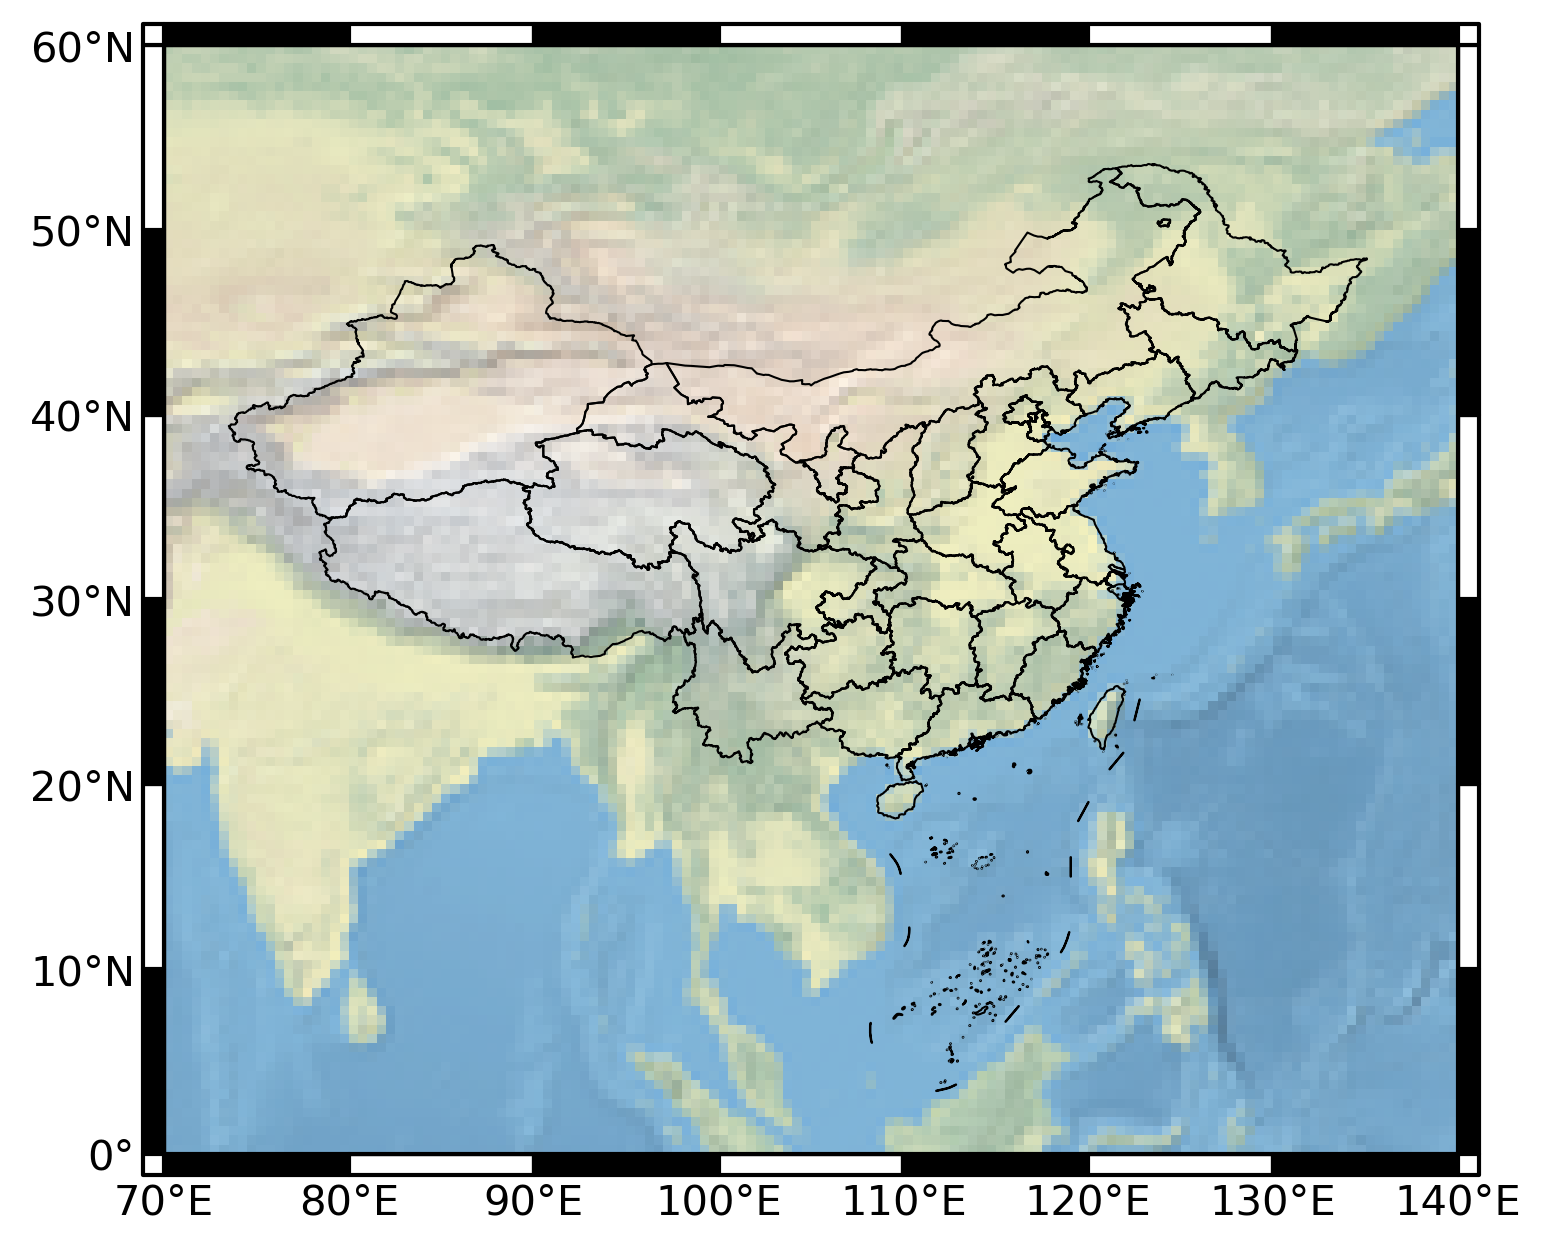
模仿 GMT 的那种风格,根据现有的刻度生成黑白格子边框。不过现在仅支持等距圆柱投影和墨卡托投影。
南海小图
import matplotlib.pyplot as plt
import cartopy.crs as ccrs
import frykit.plot as fplt

crs = ccrs.PlateCarree()
ax = plt.axes(projection=fplt.CN_AZIMUTHAL_EQUIDISTANT)
fplt.set_map_ticks(ax, [74, 136, 13, 57])
fplt.add_cn_province(ax, fc='beige')
fplt.add_nine_line(ax)

mini_ax = fplt.add_mini_axes(ax)  # 创建小地图
mini_ax.set_extent([105, 122, 2, 25], crs)
fplt.add_cn_province(mini_ax, fc='beige')
fplt.add_nine_line(mini_ax)

plt.show()
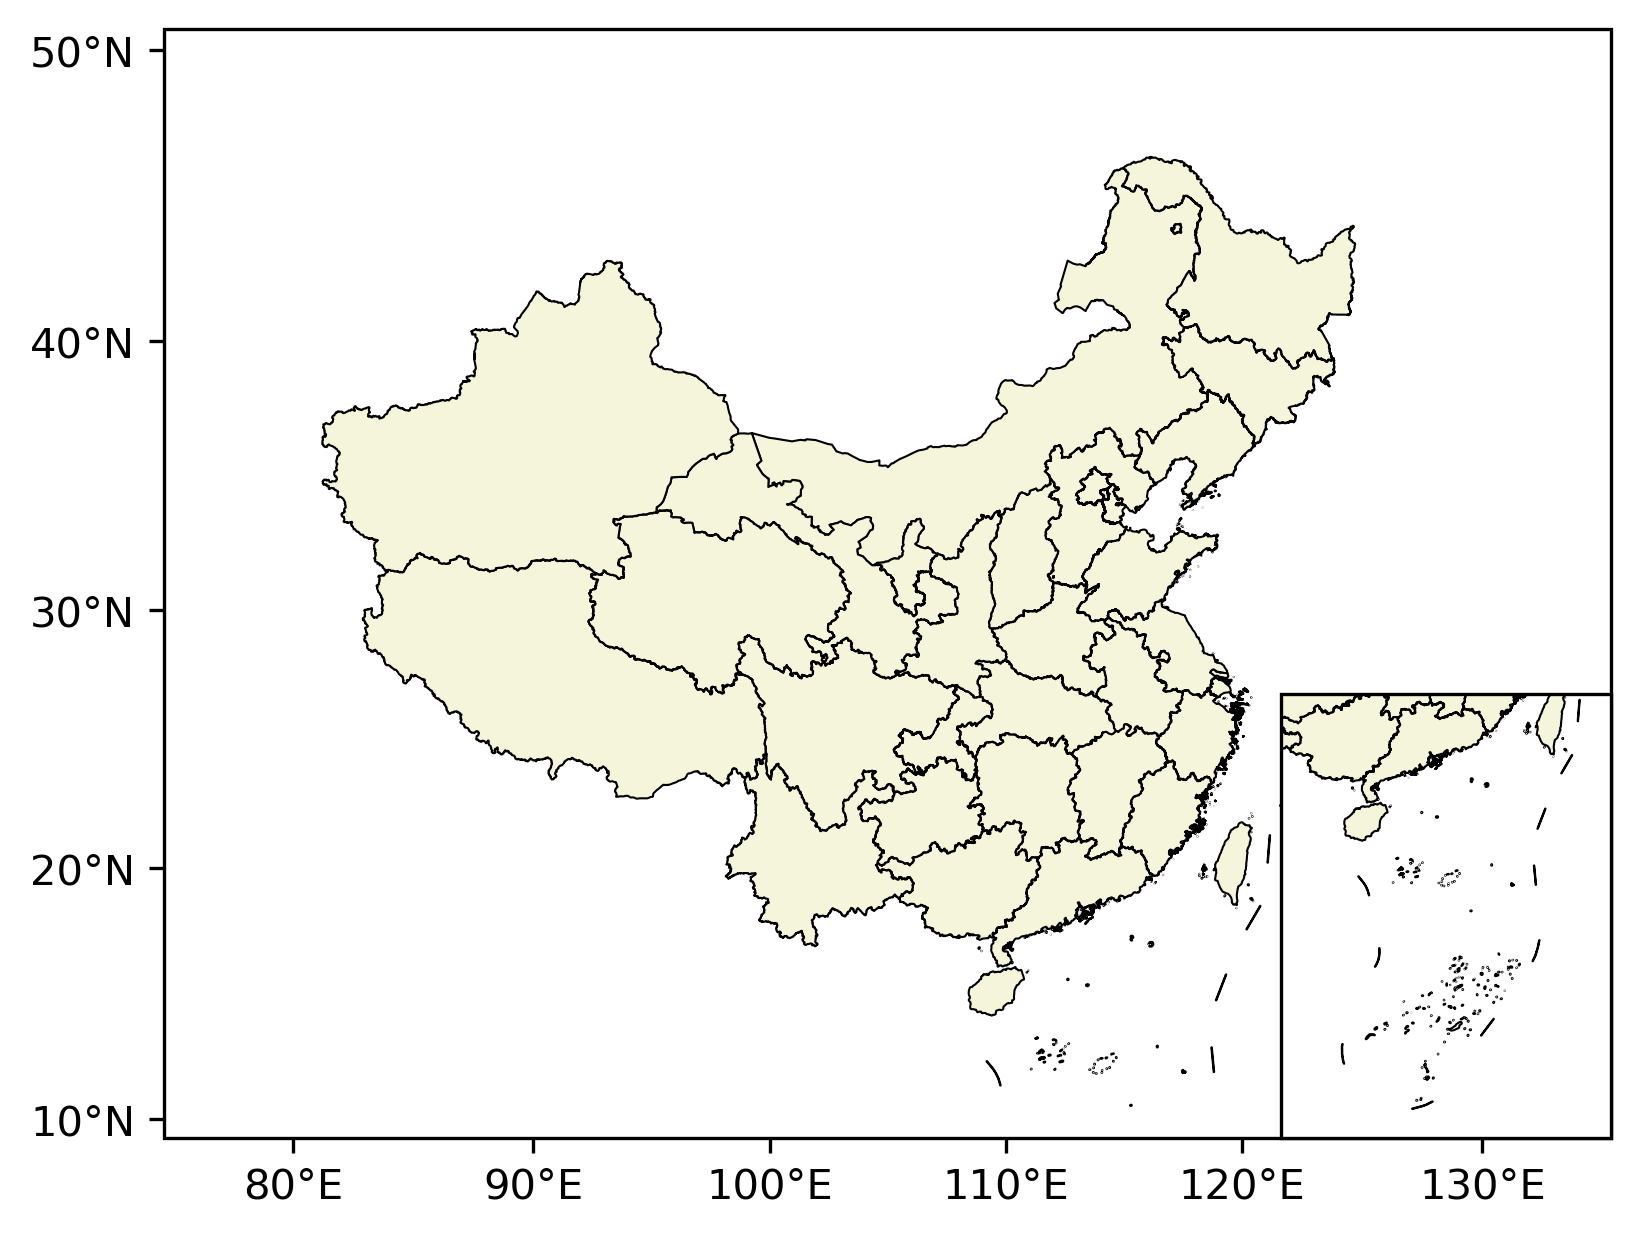
自动定位在右下角,无需像 add_axes 那样对着 rect=(left, bottom, width, height) 四个参数调半天。画组图也更便利。
结语
感兴趣的读者可以参考 GitHub 页面的说明安装试用,还请多多反馈 bug。